Intro

I am an aspiring data analyst with a strong interest in using data to uncover insights and solve real-world problems. I have been building practical experience with tools like Excel and Power BI, working on data cleaning, analysis, and creating dashboards that make information easier to understand and use. .
I enjoy exploring datasets, identifying patterns, and transforming data into meaningful insights that support better decision-making. Through continuous learning and hands-on projects, I am developing my skills in data analysis and visualization, with the goal of becoming a confident data professional who delivers value through data-driven thinking.
Logistics Fleet Analytics Project
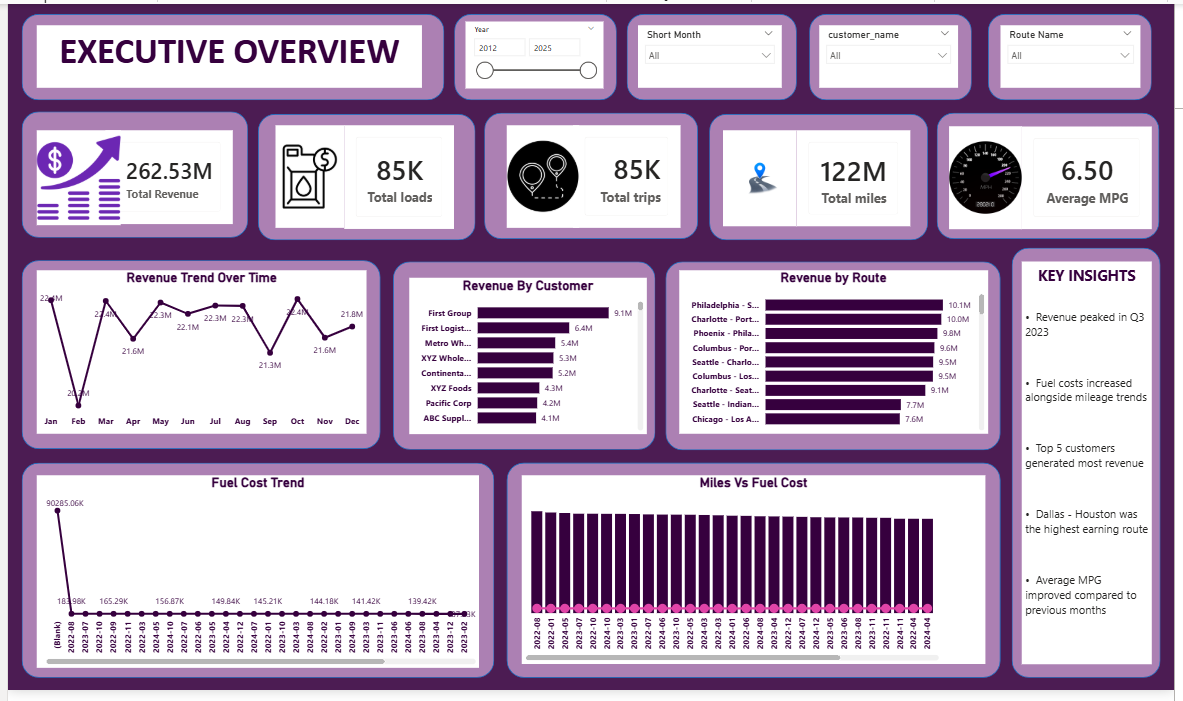
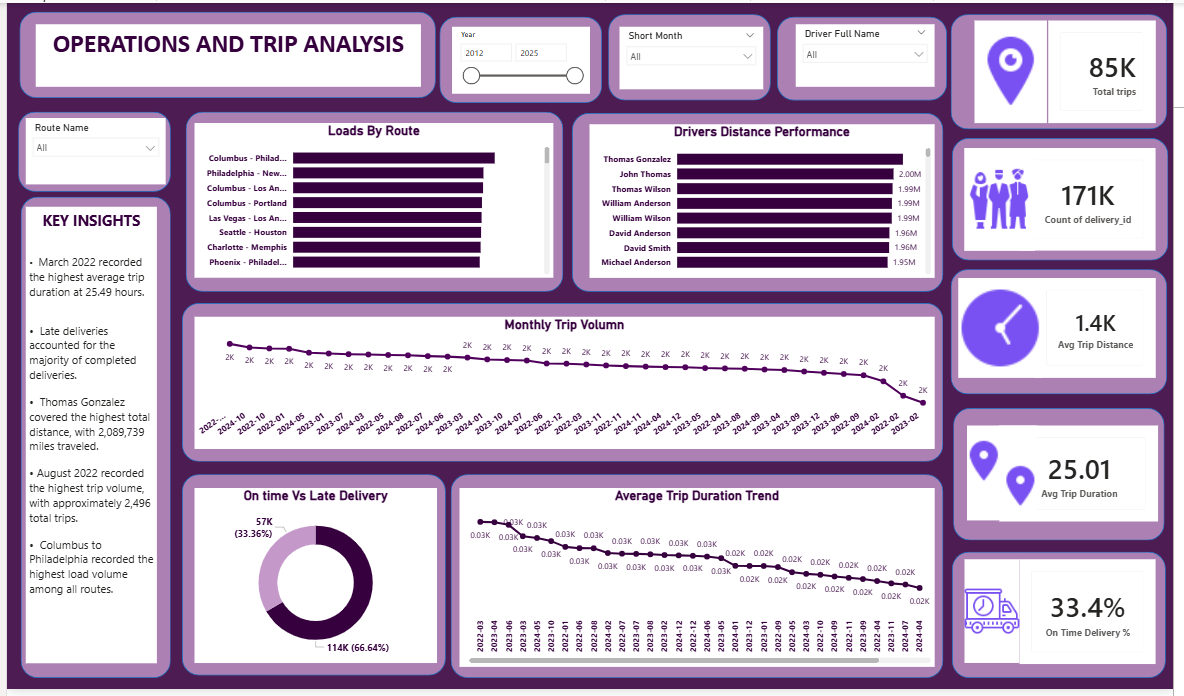
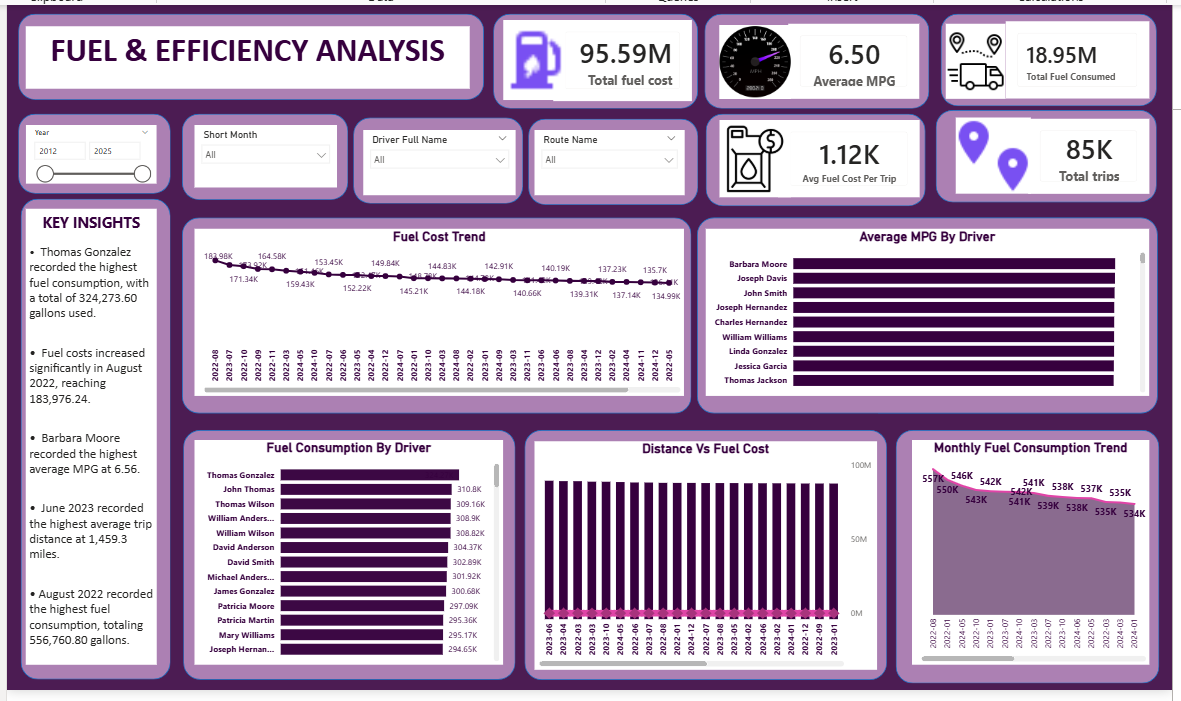
This Logistics Fleet Analytics Capstone Project was developed using Power BI to analyze and visualize key operational and fleet performance metrics within a logistics environment. The project focuses on trip analysis, delivery performance, fuel consumption, and operational efficiency through the use of interactive dashboards, KPI monitoring, and business intelligence storytelling. The dashboards were designed to provide meaningful insights into logistics operations, helping identify trends, performance gaps, and operational patterns across trips, routes, and drivers.
The project demonstrates my ability to perform end-to-end data analysis using Power BI, including data cleaning, data modeling, DAX calculations, dashboard design, and insight generation. Across the three dashboard pages — Executive Overview, Operations & Trip Analysis, and Fuel & Efficiency Analysis — I utilized interactive visualizations, slicers, trend analysis, and KPI reporting to transform raw operational data into actionable business insights. This project highlights both my analytical thinking and my ability to create professional, executive-style dashboards for decision-making.
Power Bi dashboard
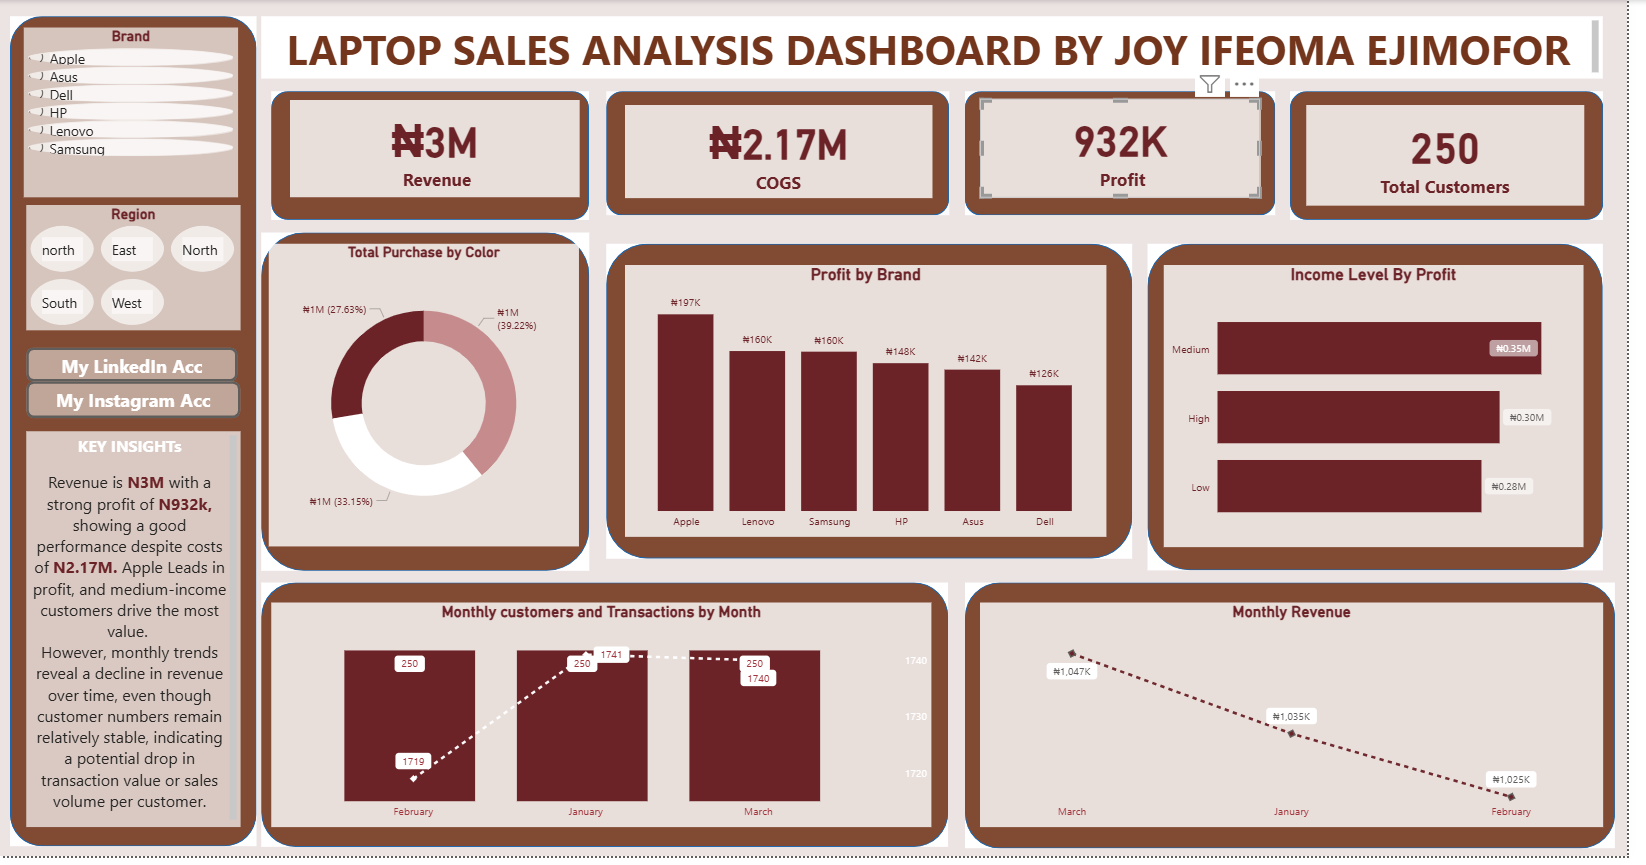
This Laptop Sales Analysis Dashboard was developed using Power BI to deliver a comprehensive and interactive view of sales performance across multiple dimensions. It highlights key business metrics including total revenue (₦3M), cost of goods sold (₦2.17M), profit (₦932K), and customer count, providing a clear snapshot of overall performance. The dashboard features dynamic filtering by brand and region, allowing users to explore specific segments in detail. Visualizations such as profit by brand, income level analysis, and monthly revenue trends help uncover patterns in customer behavior, product performance, and revenue distribution.
This project demonstrates my ability to perform end-to-end data analysis using Power BI. I used Power Query for data cleaning and transformation, and implemented data modeling techniques to establish relationships between multiple tables for accurate analysis. Additionally, I applied DAX calculations and interactive visuals to build a user-friendly, insight-driven dashboard. Key findings show that Apple leads in profitability, medium-income customers contribute the highest value, and despite stable customer numbers, revenue exhibits a declining monthly trend—suggesting a drop in transaction value or sales volume. This project strengthened my ability to transform raw data into actionable insights and design dashboards that support data-driven decision-making.
Excel dashboard
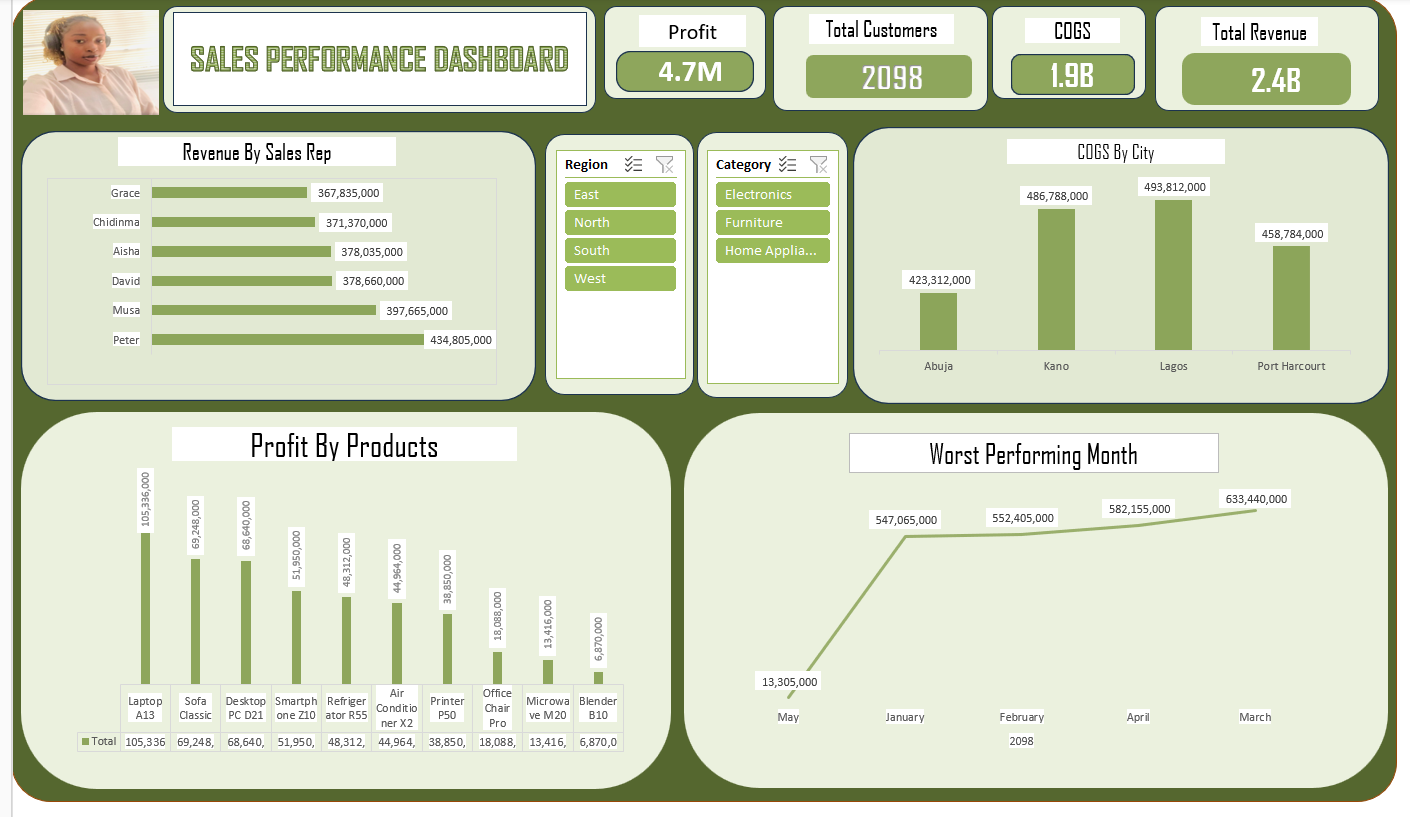
This Sales Performance Dashboard was developed in Microsoft Excel to provide a clear and interactive overview of business performance across multiple dimensions. It highlights key metrics such as total revenue (2.4B), profit (4.7M), cost of goods sold, and customer count, enabling quick evaluation of overall performance. The dashboard incorporates dynamic filtering using slicers for region and product category, allowing users to drill down into specific segments. Visualizations such as revenue by sales representative, COGS by city, and profit by product help identify top performers and areas that require attention.
The project demonstrates my ability to transform raw data into meaningful insights through effective data modeling and visualization techniques. I utilized pivot tables, advanced Excel formulas, and interactive charting to ensure the dashboard is both functional and user-friendly. Through this analysis, key trends such as high-performing sales reps, regional cost variations, and underperforming products and months can be easily identified, supporting better data-driven decision-making. This project strengthened my skills in data analysis, dashboard design, and presenting complex information in a simple, actionable format.
About

I’m Joy Ifeoma Ejimofor, a budding data analyst who has just completed a 4-month intensive training in Data Analysis, building strong practical skills in Excel, SQL, and Power BI. I am passionate about turning raw data into meaningful insights and I particularly enjoy storytelling through dashboard building, using both Excel and Power BI to create clear, interactive, and impactful visualizations. I have hands-on experience working on real projects that strengthened my ability to clean, analyze, and present data effectively, and I am currently working towards completing my capstone project to further showcase my skills. I am actively seeking opportunities such as internships or entry-level roles where I can grow, contribute, and continue developing as a data professional.
Contact
Elements
Text
This is bold and this is strong. This is italic and this is emphasized.
This is superscript text and this is subscript text.
This is underlined and this is code: for (;;) { ... }. Finally, this is a link.
Heading Level 2
Heading Level 3
Heading Level 4
Heading Level 5
Heading Level 6
Blockquote
Fringilla nisl. Donec accumsan interdum nisi, quis tincidunt felis sagittis eget tempus euismod. Vestibulum ante ipsum primis in faucibus vestibulum. Blandit adipiscing eu felis iaculis volutpat ac adipiscing accumsan faucibus. Vestibulum ante ipsum primis in faucibus lorem ipsum dolor sit amet nullam adipiscing eu felis.
Preformatted
i = 0;

while (!deck.isInOrder()) {
    print 'Iteration ' + i;
    deck.shuffle();
    i++;
}

print 'It took ' + i + ' iterations to sort the deck.';
Lists
Unordered
- Dolor pulvinar etiam.
- Sagittis adipiscing.
- Felis enim feugiat.
Alternate
- Dolor pulvinar etiam.
- Sagittis adipiscing.
- Felis enim feugiat.
Ordered
- Dolor pulvinar etiam.
- Etiam vel felis viverra.
- Felis enim feugiat.
- Dolor pulvinar etiam.
- Etiam vel felis lorem.
- Felis enim et feugiat.
Icons
Actions
Table
Default
| Name |
Description |
Price |
| Item One |
Ante turpis integer aliquet porttitor. |
29.99 |
| Item Two |
Vis ac commodo adipiscing arcu aliquet. |
19.99 |
| Item Three |
Morbi faucibus arcu accumsan lorem. |
29.99 |
| Item Four |
Vitae integer tempus condimentum. |
19.99 |
| Item Five |
Ante turpis integer aliquet porttitor. |
29.99 |
|
100.00 |
Alternate
| Name |
Description |
Price |
| Item One |
Ante turpis integer aliquet porttitor. |
29.99 |
| Item Two |
Vis ac commodo adipiscing arcu aliquet. |
19.99 |
| Item Three |
Morbi faucibus arcu accumsan lorem. |
29.99 |
| Item Four |
Vitae integer tempus condimentum. |
19.99 |
| Item Five |
Ante turpis integer aliquet porttitor. |
29.99 |
|
100.00 |